Device Overview
This page talks about what you can do with and what information is available for all of the devices that have been provisioned and associated with your account. A high level view of your devices is shown in the device table on the Devices tab on the alwaysAI console. Clicking on a device will open a more detailed view of that device where you will get device information and can perform actions on your device. To learn about the provisioning process go to the Device Provisioning page. The Deploying Your Application page will show you how to deploy an application to your device, which can then be controlled from the detail screen.
Device Table

The device table is a good way to get an overview of your devices. The table displays the following:
Device Name - the friendly name given to your device during provisioning. This can be changed on the Device Details page.
UUID - the unique ID given to your device during the provisioning process.
Host Name / IP Address - if this information is available, it will be displayed.
Username - your alwaysAI username.
Mode - communicates the device mode, either Development or Production.
Status - Whether you are connected to your device or not
Actions - Trash can deletes the device from your account. Open navigates to the device details page.
Device Details

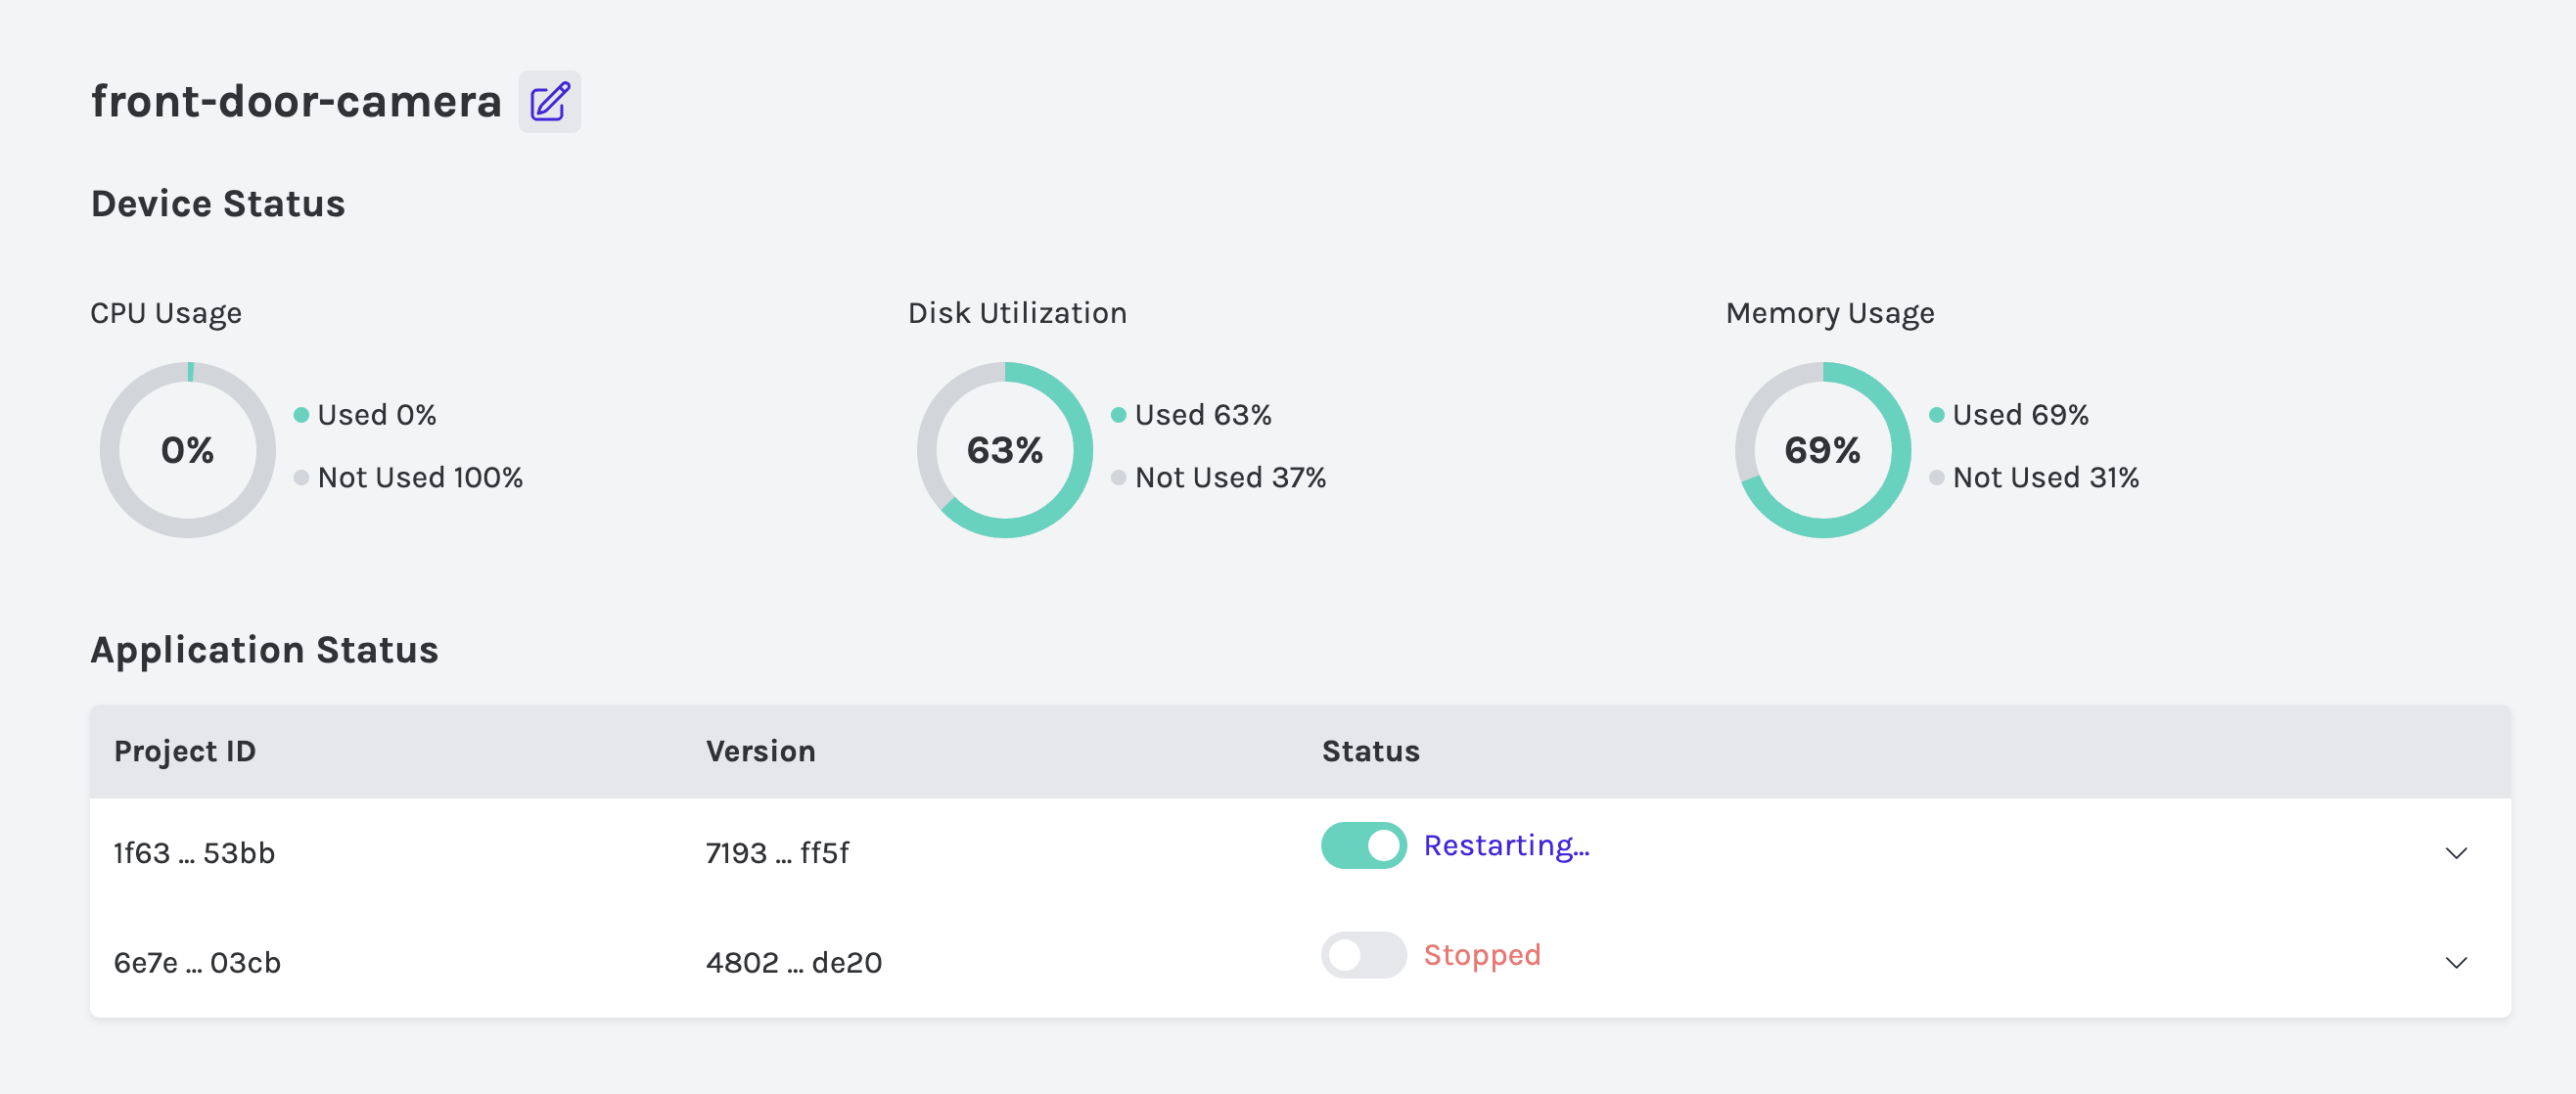
The Device Details page gives you more insight into your device. You can change the friendly name of your device by clicking the edit button next to the device name
Device Status
The Device Status section is where you can see performance metrics for your device. The charts allow you to monitor your device for any operational issues. The real-time metrics displayed are:
CPU Usage
Disk Utilization
Memory Usage
Temperature
Application Status
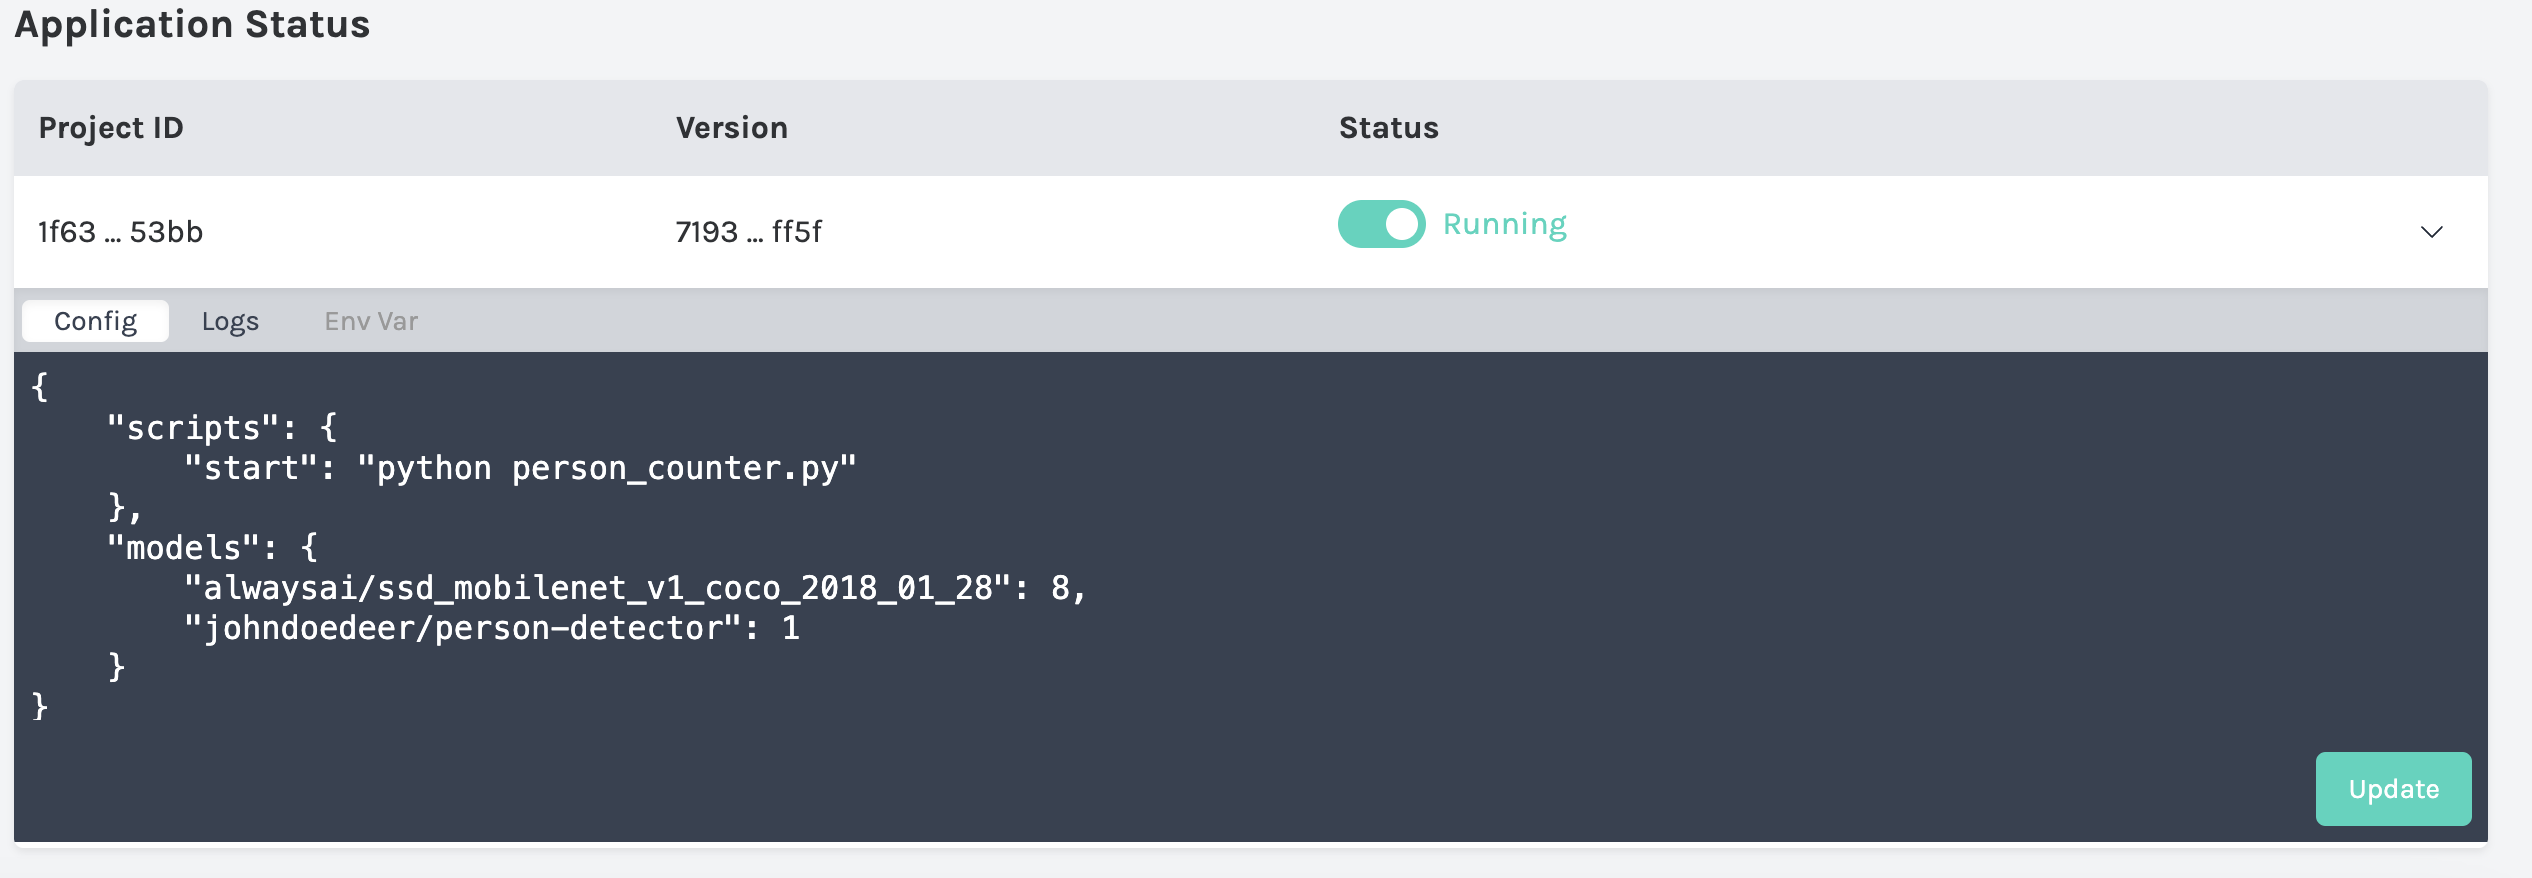
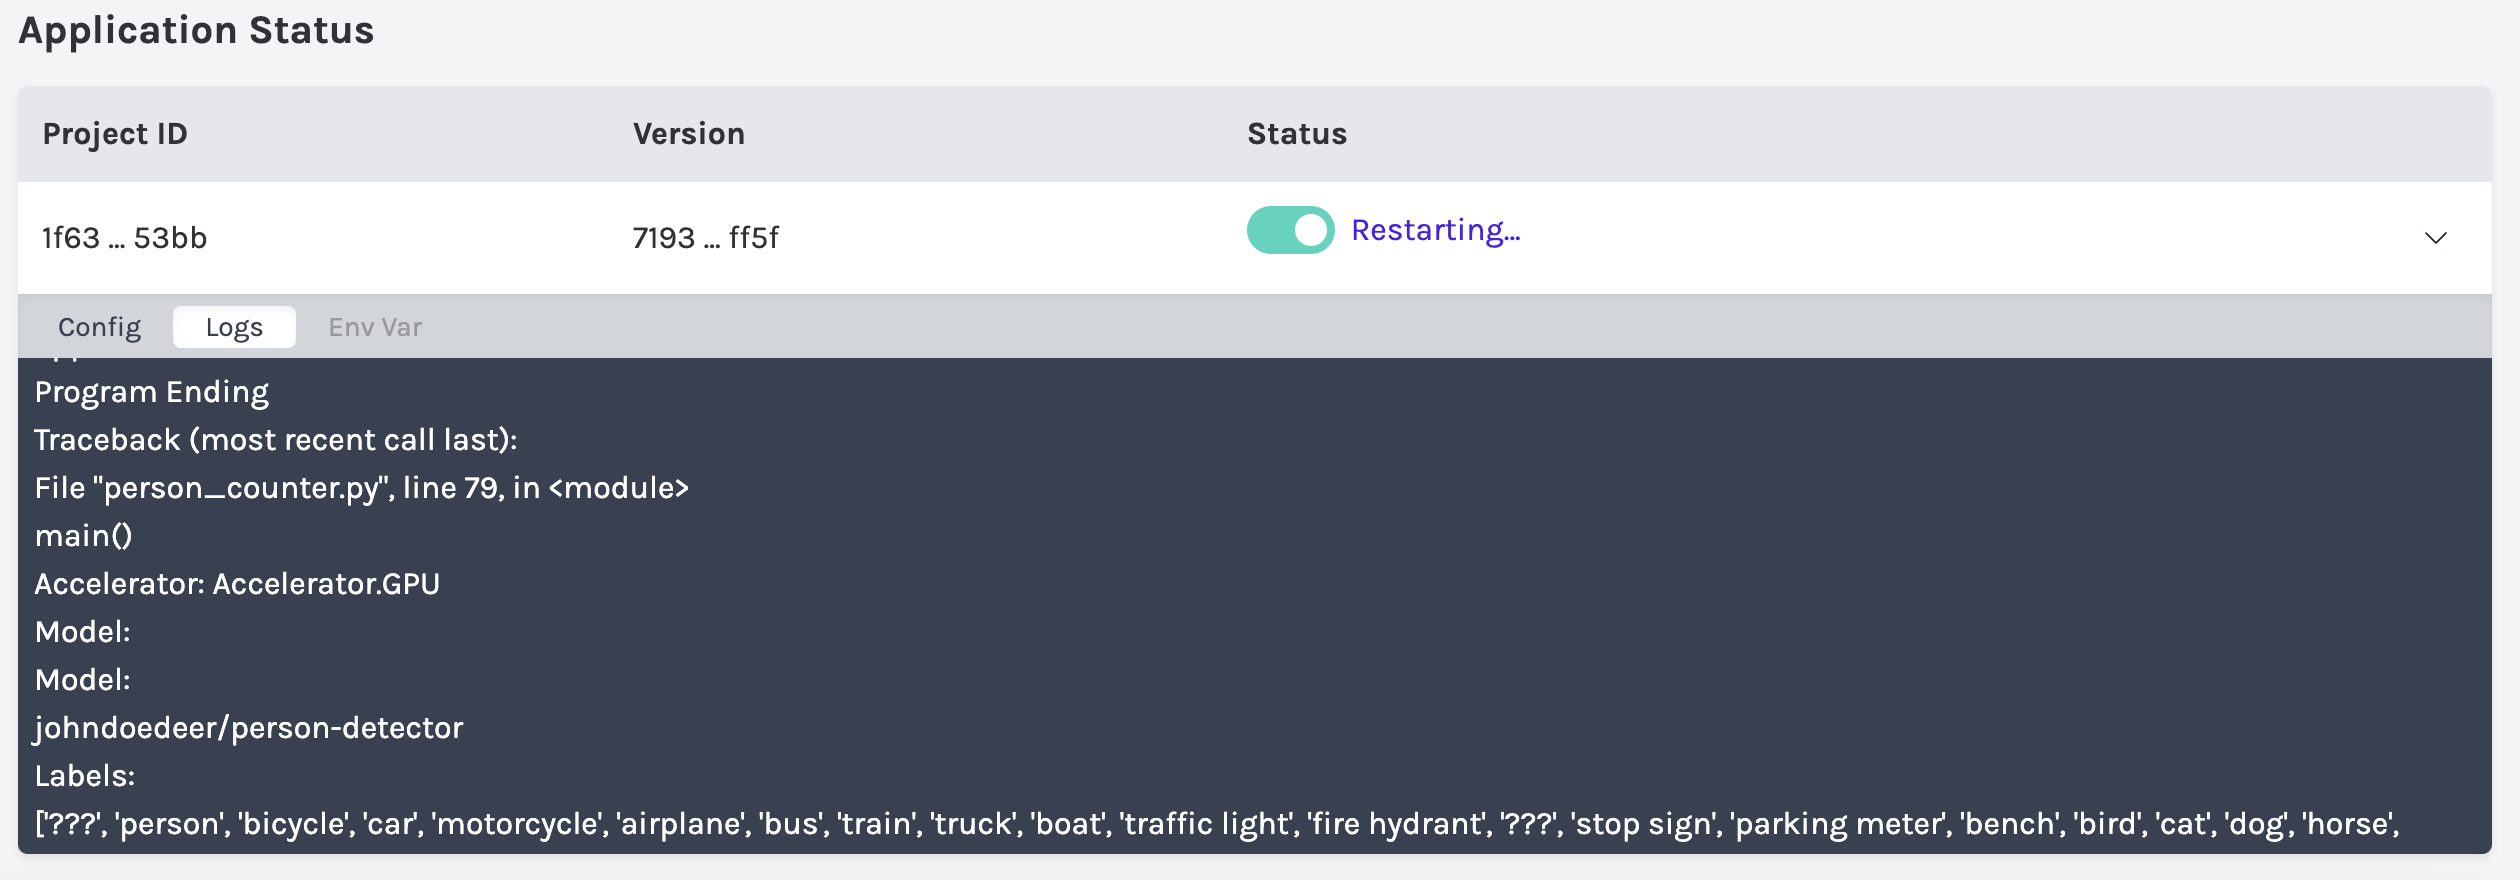
The Application Status section displays a table of currently installed applications. Applications can be stopped and restarted using the switch found on each table row. Project ID is the project that is associated with the application and Version is the specific release. Click the down arrow on each row to reveal Configuration and Logs.

Configuration
The Configuration Tab displays the configuration file for the currently installed application. You can update this file to change the file that runs at application start. You can also add or remove models from this interface. This file is flexible and you can incorporate different settings in your application logic.
Logs
The Logs tab displays the current device logs in real-time. These can be used for troubleshooting or to get a more detailed status.

Secure Tunnel
alwaysAI Secure Tunnel enables you to connect to a remote device over SSH with
the alwaysAI CLI. On your computer, run aai device connect and you will be
prompted with a list of devices to connect to.
NOTE: Device must show “Connected” on the Device Details page for Secure Tunnel to work for that device.
Copy Files
To copy files to and from the device using Secure Tunnel, use scp from your
computer. First, find the port number used for the connection from the Secure
Tunnel log file located at
<home_directory>/.config/alwaysai/secure-tunnels.json. The SSH port will be in
the sshPort field. For example, here the port is 5011:
{
  "<device-id>": {
    "expiresAt": ...,
    "sshPort": 5011,
    "sourceAccessToken": "...",
    "tunnelId": "..."
  }
}
With Secure Tunnel connected in one terminal, Open a new terminal and run the
scp command below, filling in your information:
scp -P <secure_tunnel_port> <remote_username>@localhost:<remote_file_path> <local_destination_path>
NOTE: Data transfer is throttled to the 800 Kbps bandwidth per the secure tunnel limitations, so may not be appropriate for very large files.
HTTP Port Proxy
alwaysAI Secure Tunnel can also forward a port from the device to view remote HTTP pages, for example, a dashboard running locally or the web interface for a camera. To enable port proxy, run the following CLI command:
aai device connect --proxy <ip:port>
For example, if you have a camera on the device’s local network at 100.70.31.118 port 80, you would run:
aai device connect --proxy 100.70.31.118:80
The resulting logs give the local URL:
Starting docker container with local http proxy: http://localhost:5012
So you could now access the camera’s dashboard by navigating to http://localhost:5012 in your web browser.